


In 2023, 53% of recruiters reported that their job was more stressful than the previous year. Many factors impact this, such as few qualified candidates, high demand for them and lack of hiring resources. While identifying root causes is important, we don't believe in dwelling on them but rather in finding solutions.
If you want to maximize the value of your talent acquisition team's efforts in terms of quality and quantity, you need to track recruiting metrics. These numbers show exactly which areas of your hiring process should improve and which are doing well so you can do more of that good stuff.
In this article, we'll take you through the 15 most crucial recruitment metrics and explain how to calculate them. Stick around to the end to discover a valuable tool that will help you improve them and make finding quality hires a breeze.
What are recruitment metrics?
Recruitment metrics are pieces of information that help you see how effective and efficient your hiring process is. They reveal areas of improvement but also show successful practices, allowing you to apply the same approach in different aspects of your recruitment strategy.
15 key recruitment metrics to track
Time to hire
Time to hire refers to the days between a candidate applying for your job opening and the moment the hiring process ends.
You can set the ending of the hiring process to what's the most adequate for your company:
- The day of making an offer
- The day of someone accepting the job offer
- The first day of work for the new hire
Research shows that the average time to hire is about 32 days (in this case, between the initial call with the candidate and the final candidate approval).
This recruitment metric gives you insight into two main aspects:
- Hiring efficiency: A long processing time means some bottlenecks need resolving. Look into additional recruiting metrics to discover where the problem lies, particularly the time in each process step.
- Candidate experience: Applicants want the shortest possible hiring times, so cutting down on this metric will improve your candidate's net promoter score. This means they'll be more likely to recommend your company to others and start working for you with a positive attitude and higher morale.
Time to fill
Time to fill is the time from the day the job requisition is opened to the time of hire. The main difference between the time to fill and the time to hire is that the first starts when a job position is open or needs filling, while the second starts from a candidate's application. Set the ending for both to the same moment for the best clarity.
The average time to fill in 2023 was 47 days – a week longer than the standard from previous years. If your score is close to or above this number, you may want to accelerate it. Cutting down the time to fill means extracting value from the recruits faster and creating a better candidate experience, which helps you build a positive employer brand. It also reduces the risk of losing in-demand talent to your competitors.
Modern recruitment automation technology can improve your recruitment time by 40%.
Cost per hire
To calculate your cost per hire, sum up the internal and external recruiting costs and divide the total by the number of new hires. Internal recruiting costs may include your recruiters' salaries, referral bonuses and any recruitment-related technology you use, while external recruiting costs refer to expenses like job board fees, agency fees, advertising costs etc.
According to SHRM, the average hire cost is almost $4,700, but some experts estimate it to be even more – up to four times the position's salary. VireUp helps you reduce recruitment costs by 45%.
Another option is to implement employee referral bonuses, which can be more cost-effective than traditional ways of looking for quality candidates. However, be careful with this method, as relying too heavily on employee referrals can lead to a lack of diversity in the candidate pool and the risk of favoritism in the hiring process.
Quality of hire
Quality of hire can include any number of factors, such as:
- Job performance
- Ramp-up time
- Engagement
- Cultural fit
- Retention
Score the factors that matter most to you on a scale of one to 100, sum them up and divide the total by the number of factors you took into account.
Improving the quality of hire recruiting metric is the main goal of HR managers for 2025. However, this means something slightly different for everyone. You must identify the key factors aligning with your company goals and culture. Good quality hires mean better productivity and less turnover.
You can use various skill assessment software to ensure you settle on the right fit.
Candidate satisfaction score
Candidate satisfaction score or candidate net promoter score evaluates the candidates’ level of satisfaction with the hiring process and answers the question of how likely candidates are to recommend your company as an employer.
You can calculate the candidate's net promoter score by asking, “Based on your experience as a candidate, how likely are you to recommend applying to [Company] to others?” in a follow-up email. The respondents answer with a number between one and ten, respectively – very unlikely to very unlikely.
Based on the score they give, the candidates fall into one of these categories:
- 0-6: Detractors (unlikely to recommend your company)
- 7-8: Passives (neutral)
- 9-10: Promoters (likely to recommend your company)
To get a candidate NPS, subtract the percentage of detractors from the percentage of promoters.
Here's a visual guide on interpreting and working on your candidate satisfaction score.
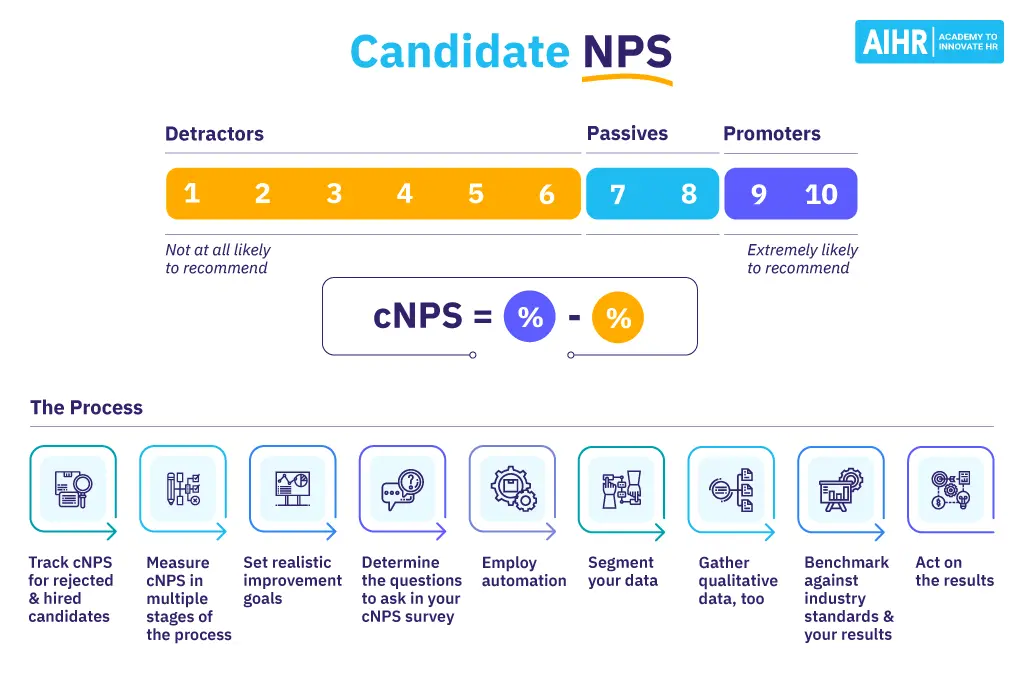
Recruitment metrics: Candidate NPS
Improving this recruiting metric is vital. Studies show that negative reviews influence how existing and prospective employees view your company, with over half of applicants admitting to changing their minds about a role after stumbling across negative reviews. Ultimately, candidate dissatisfaction can lead to decreased interest in applying to your open positions and talent attraction challenges.
With AI recruiting tools to boost your recruiting efforts, you can reduce candidate dissatisfaction by up to 80%.
Source of hire
A source of hire shows the percentage of hires coming from different recruiting channels, such as:
- Job boards
- Employee referrals
- Career websites
- Recruitment agencies
- Social media strategy
You can get the percentage by dividing the number of hires from a specific source by the total number of hires and multiplying the number you get by 100.
Track the sources that bring you the most candidates so you can optimize the resources spent on future hires. It can be as simple as asking them where they found your job description. Based on this information, you should invest in the channels that consistently give you high-quality candidates and cut down activity on those that don't.
Sourcing channel effectiveness
You can focus on quantity or quality to determine the sourcing channel's effectiveness:
- Quantity refers to the number of candidates who applied via one channel in a certain timeframe. Compare the totals for every channel to identify the one that attracts the most applicants.
- Quality refers only to the number of quality candidates from all job postings, referrals or career communities. This requires the additional work of giving each applicant a value score, as in our “Quality of hire” section.
A 2023 report shows that 25% of hiring teams consider job boards their most valuable sourcing channel. Other effective ways to find new employees include:
- Internal hiring (16%)
- Social media (14%)
- Employee referrals (13%)
- Career websites (9%)
- Direct applications (6%)
Number of open positions
When you track the number of open positions at your company, you can get additional insight into the vacancy rate. This is the number of open positions in your company divided by the total number of positions in the department or the whole organization, then multiplied by 100.
If you get a high percentage, it means there are a lot of roles to fill. It may be a good sign that your company is growing fast. However, if this state continues for a long time, you should look into the risk of burnout among your employees linked to understaffing.
You should review the number of open positions in your country to see how competitive the employer market is. In November 2023, it was almost 8.8 million in the US – a significant drop from the previous two years. This means you can probably be more picky about your candidates. It would be even better to look into the current stats in your niche.
Application completion rate
Application completion rate is the percentage of candidates who complete the entire job application process out of the total number of candidates who initiated the application.
To get the percentage, divide the number of submitted applications for your job posting by the number of started applications and multiply by 100.
An applicant tracking system comes in handy because it shows you how many job seekers get frustrated enough that they abandon your application platform. A high abandonment rate may result from too long, poorly structured or too personal questions, a lack of clarity about the hiring process, technical issues or repetitive information requests (asking candidates questions the answers to which are already available in the CV).
Applicants per opening
This is the total number of people who have applied for the position.
In 2023, the average number of candidates for a role was 278, a 120% increase since 2021. Benchmarking your metrics against these numbers shows you how attractive a particular position is, what the current competition for talent is and how effective your talent attraction channels are.
Time in process step
This is the amount of time an applicant spends in each step of the hiring process. These include:
- Application reviews
- Interviews
- Pre-employment tests and assessments
- Reference checks
- Negotiation
- Contracting
- Onboarding
As mentioned above, this breaks down the information about your time to fill and hire. Tracking the time spent in each process step helps to pinpoint your hiring bottlenecks, and you should easily find this information in your applicant tracking system or hiring workflow.
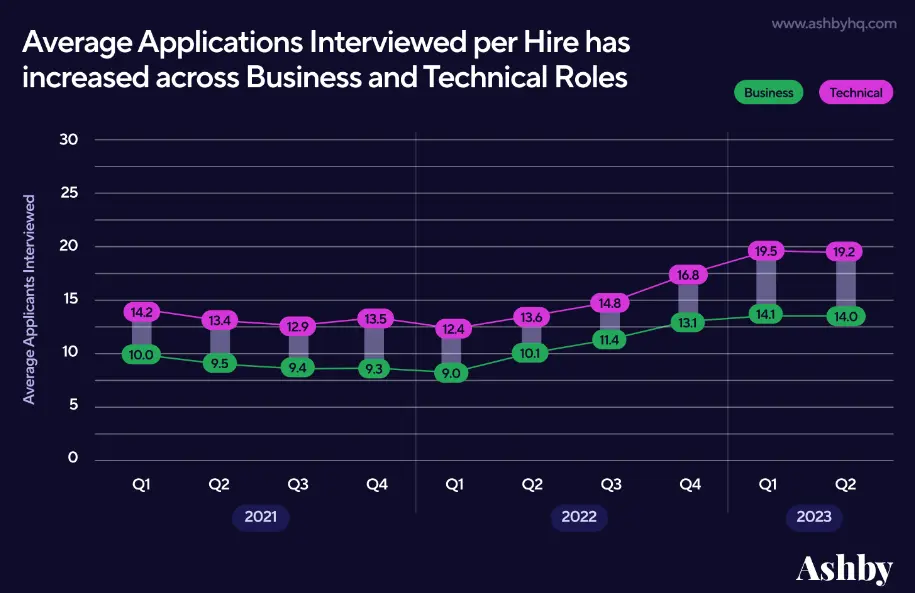
Interview-to-hire ratio
This is the total number of interviews conducted per each successful hire. To get the number, divide the number of hires by the number of conducted interviews.
The average interview-to-hire ratio for business and tech industries in 2023 was 16.6 – an increase from the previous years.
Recruitment metrics: Interview to hire
A higher number indicates that more candidates are given a chance to express themselves but the resource impact needs to be considered. Therefore, automation may help to increase this number in a favorable way.
Offer acceptance rate
The offer acceptance rate refers to the percentage of job offers extended by an employer that candidates accept. Divide the number of job offers accepted by the total of offers made and multiply that by 100 to get a percentage.
A low offer acceptance rate may indicate a mismatch between the offer and the expectations of the candidates. The consequences are further delays in filling positions and wasted recruitment resources.
The offer acceptance rate in 2022 was close to 69%. If your score is significantly lower, you may need to present the salary package and benefits earlier in the recruitment process, give more insights about the role responsibilities and growth potential or ensure a more pleasant interview experience.
Transparency about compensation and benefits is one of the key aspects to focus on. As the CHRO for Kerbey Lane Cafe aptly put it, “If you don't invest in your people, they will feel like you don't value them”.
Time to productivity
The time to optimum productivity level measures how long it takes a new employee to get to the point where they contribute to the company with their full potential. This is one of the most important recruiting metrics, showing you how efficient your recruitment and onboarding process is.
Turnover rate
The turnover rate is the percentage of employees who leave a company over a specific period, which illustrates your hiring success in the long run. Track the number of employees who left their positions during the measurement period (usually the first year of work). Divide it by the total number of employees within that period and multiply by 100.
At first glance, this metric is more connected to employee satisfaction. However, it's also linked with your recruiting process because it shows if you're hiring people who fit well into your organization's work environment.
Unmanaged attrition (voluntary turnover) frequently results from mismatched expectations, while managed attrition (terminated by the employer) could indicate a bad fit or poor performance.
How can VireUp help you improve your recruitment metrics?
According to experts, the best way to improve your recruitment metrics is to use new technologies, like a smart, AI-powered recruiting tool, because they can significantly enhance the efficiency of your talent acquisition team. About one-third of recruiters started incorporating AI technologies in 2023 to help counteract hiring challenges, and more than 40% are focused on ensuring the hiring process runs faster.
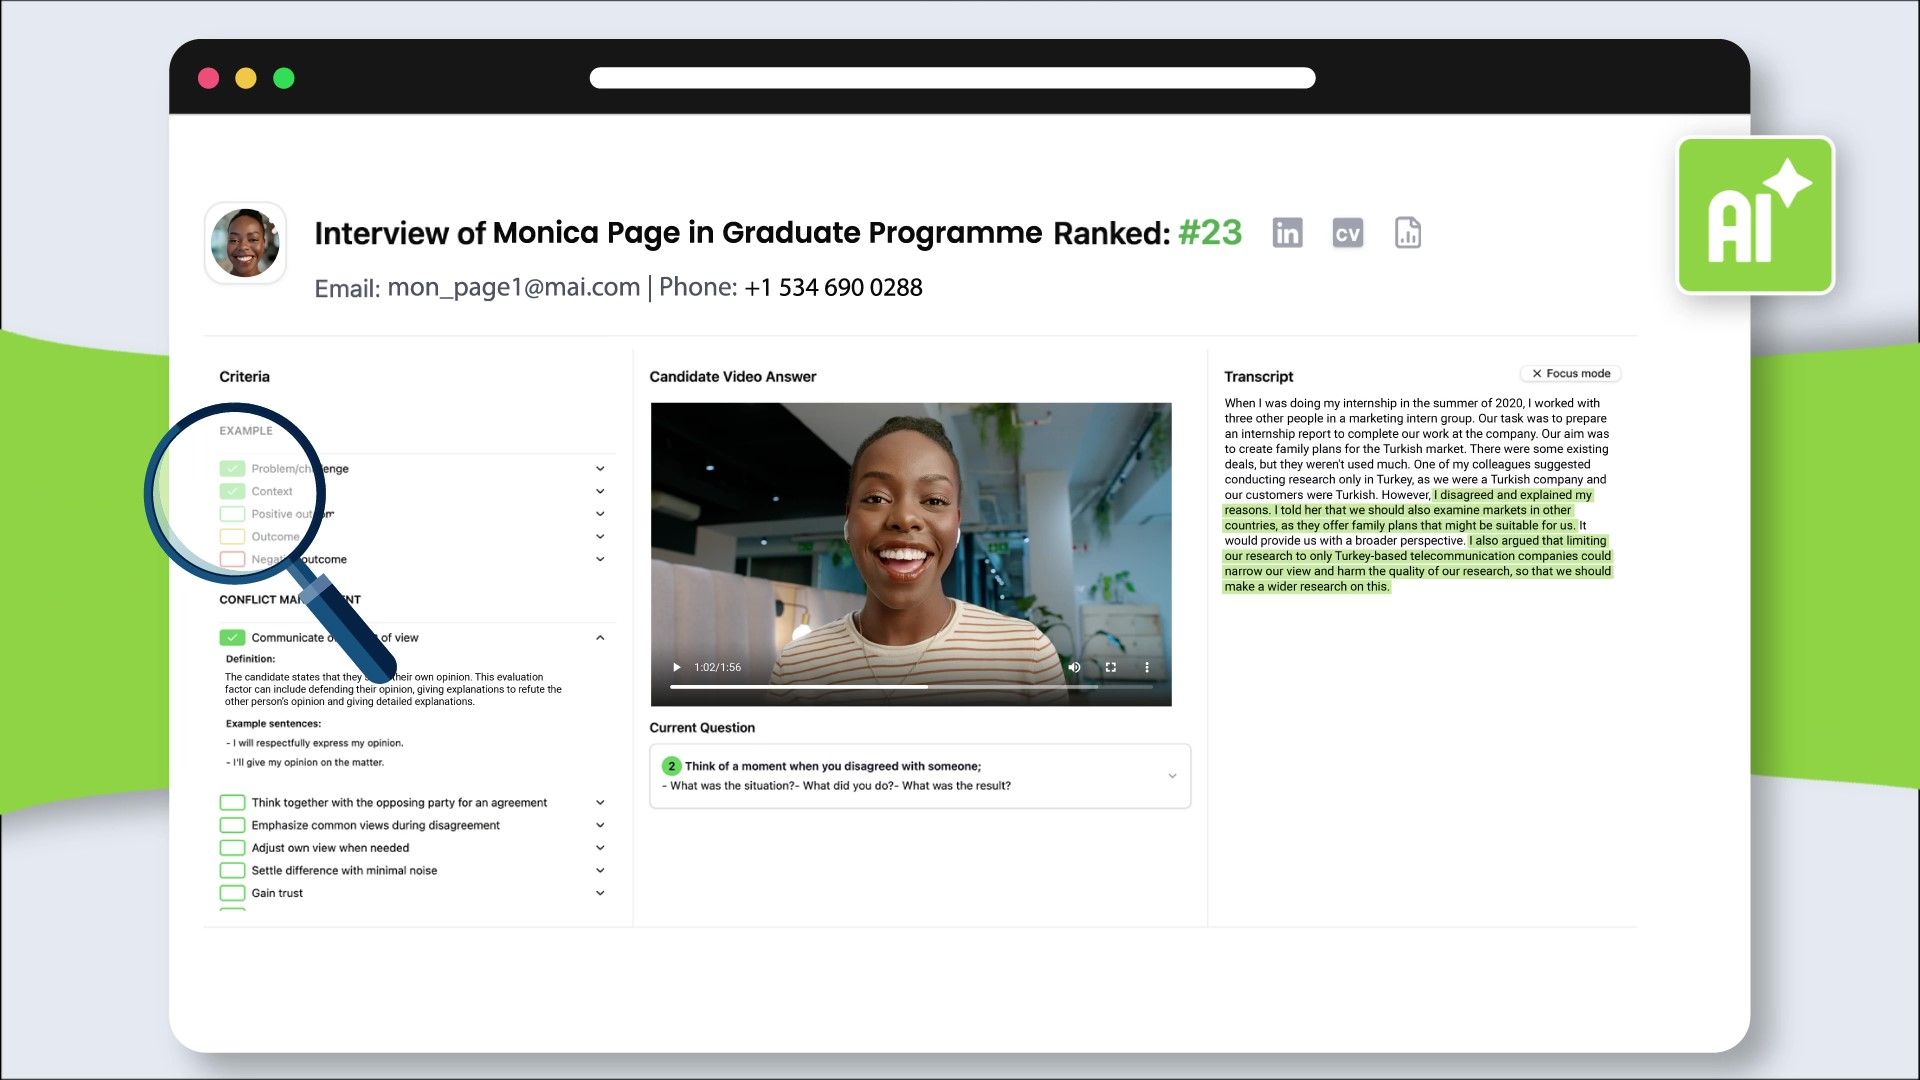
VireUp is a groundbreaking tool to help you do both. This video interview platform uses Natural Language Processing to analyze the content of job interviews on your behalf, streamline hiring and help you hire the best candidates, faster and cheaper.
VireUp dashboard
The main advantage of this video assessment tool is that you can review every applicant, as opposed to just the 2% of job seekers who are usually interviewed via traditional methods.
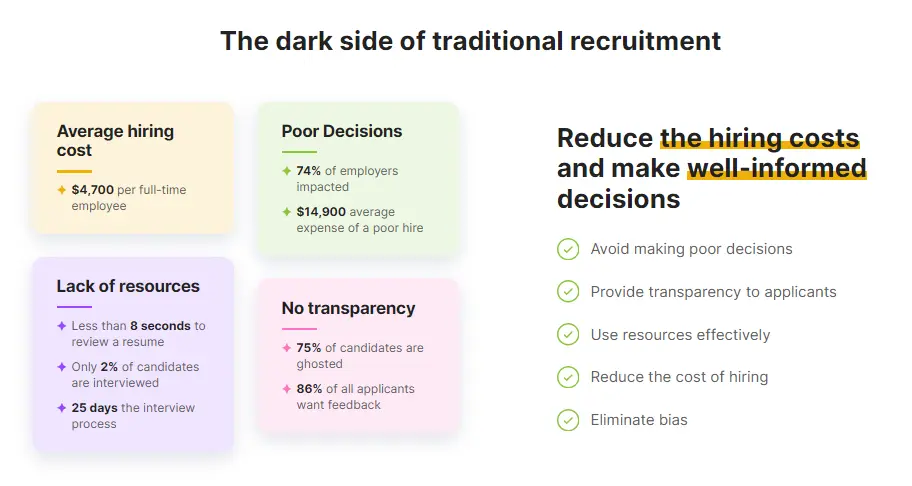
Cons of traditional recruitment
We help you create competency-based questions for various positions to focus on skills-first hiring. Then, VireUp screens all candidates against the same criteria. VireUp’s AI analyzes the interview sentence by sentence to give you an unbiased summary of each applicant's performance and even spoken English level.
Don’t worry, it doesn’t make the hiring decisions for you. Explainable AI shows you exactly how it came to its conclusions, and you can accept or reject its reasoning. At the end of the day, you still have all the decision-making power, just with significantly more insights to guide you.
You can share this feedback with rejected candidates to help end the era of “We regret to inform you...” and transform it into actionable, coaching-style tips on improving. As it turns out, 86% of all your applicants want feedback, but currently, about 75% never receive any form of reply post-screening.
Video interview
Customer story
VireUp helped Metro, a retail company with over 4,500 staff, conduct over 500 interviews within just a few weeks. They hired 25 interns across 10 departments without missing any good candidates. Here's an overview of the results of this innovative recruitment process:
- Candidate throughput increased by six times
- Recruitment lead time cut down by 50%
- Candidate experience rated 4.6/5 by applicants
- Candidate CSAT score reached 91%
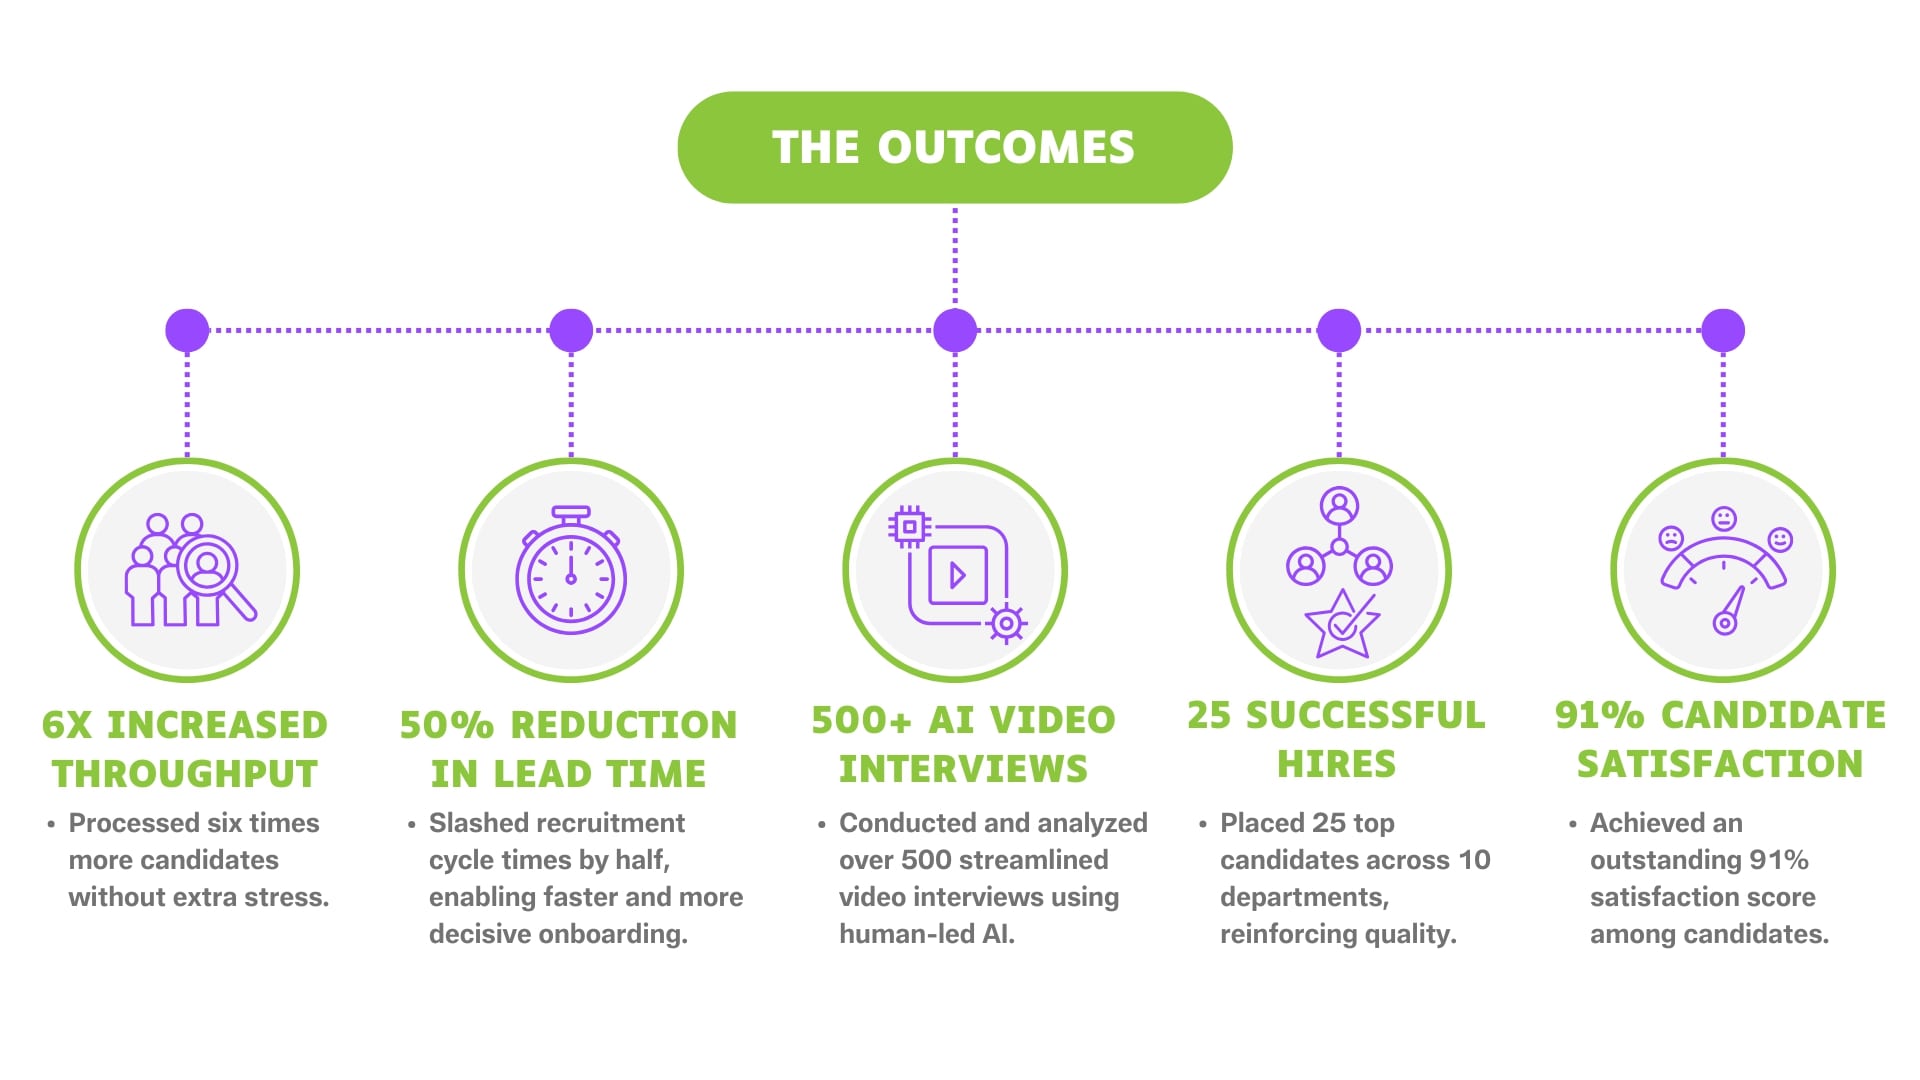
Metro recruitment metrics with VireUp
Conclusion
Consistently tracking the key recruitment metrics from this article will help you make informed decisions that will refine your hiring process.
VireUp will make these improvements effortless, helping you save time and money while filling your job openings with top talent. Customized interview questions and explainable AI with Natural Language Processing do most of the work for you. At the end of the process, you get transparent, actionable dashboards with carefully interpreted results ranked to meet your expectations best.
Try the product yourself to see how it can improve your recruiting metrics and save thousands on recruiting costs.
FAQs
What metrics are important for recruitment?
The most important recruitment metrics include:
- Time to hire
- Time to fill
- Cost per hire
- Quality of hire
- Candidate satisfaction score
- Source of hire
- Sourcing channel effectiveness
- Number of open positions
- Application completion rate
- Applicants per opening
- Time in process step
- Interview-to-hire ratio
- Offer acceptance rate
- Time to productivity
- Turnover rate
What are good recruiting ratios?
Here are some examples of good recruiting ratios:
- Application-to-interview ratio
- Interview-to-hire ratio
- Offer-to-acceptance ratio
What is a KPI for recruiters?
Key performance indicators for hiring managers are measurable recruiting metrics that help assess the effectiveness and success of their recruitment efforts. Every company might want to focus on slightly different data, depending on their goals and priorities. This article lists the 15 most common hiring metrics.
How do you measure success as a recruiter?
Recruiting teams can track their success rates by measuring the hiring KPIs mentioned in this article. You may want to combine the quantifiable metrics with qualitative assessments and general hiring manager satisfaction for a more comprehensive view.